[[ page_title ]]
Global Production Forecast
The production forecast built from the planting and production data projects the global industry volume crossing the 3,000 (000) MT milestone by 2025. This milestone will be driven by continued growth from the Americas, followed by Asia/Pacific* and then the EMEA region, the latter running about two years behind the Asia-Pacific with a similar rate of growth. The report team, however, feels that there is a probable downward trend in this forecast as there are real limitations to production and planting increases including access to land, water and labor, particularly in Latin America that put a constraint on growth which our model is not setup to capture. Additionally, it is the opinion of the report team that over the next couple of years the industry will begin to transition from high growth to a more mature stage, which will clearly have an effect on long term projections.
This year’s projections offer an important improvement in the technology used to create the predictions. By employing Machine Learning, our methodology identified the amount of history used by regressions that offers the least amount of error for each producing region in the dataset.
To add context to the projection, the charts present a scenario (solid line under the forecast) where the growth observed is coming exclusively from hectares planted in 2021 and coming into commercial operation within the next four years. This means that no additional plantings, or increases in yields are used in the forecasts offering the lowest realistic scenario for production, which we labeled as base in the charts. That said, knowing that plantings continue to go in the ground makes the zero growth scenario impossible, but it offers perspective allowing the likely future growth for the industry to lie somewhere between the forecast and the Zero Growth Scenario.
See Production Forecast Methodology at the end of the report for more information.
Americas Production Forecast
The Americas are the world’s powerhouse of production. By 2025 - 2025/26, the forecast created from our historical regression projects the region’s production to 1.6 billion kilos. This number needs to be taken cautiously as explained earlier.
After all the turmoil of the pandemic in 2020, 2021 has broken records for production seeing increased growth for every subregion. In South America the main driver of production continues to be Peru seeing even levels of growth in both hectares and yields. A considerable increase in plantings is expected to come on-line in Chile after 2023, adding significantly to production in the region if uncompetitive fields likely to be removed are not taken into consideration. North America’s production is also expected to continue to grow led by the Western US producers, although most other origins are expected to remain stable. Mexico/Central America, led by Mexico, is growing at a faster rate than South America, albeit from a much lower base. As both South America and Mexico/Central America regions come into maturity, the growth rate is expected to slow down and begin to stabilize, this is partially reflected in the forecast although, as previously mentioned the report team feels that these projections are likely high.
Asia/Pacific Production Forecast
The proverbial elephant in the room is Asia, predominantly led by China. There are a large number of hectares that are expected to come on-line in the next four years driving these numbers.
Echoing last year’s report and as outlined elsewhere in the document, it would be reasonable for a reader to suppose that the data available for China is likely higher than what may actually be produced*. Unfortunately the true values for Chinese production are simply not knowable today. To offer this information in a relevant context as best we can, the report team assumes that the real growth rate of plantings in hectares is 6% while, for the purposes of this forecast the yields have been maintained at their 2021 levels.
Importantly, growth in China is expected to continue. As of yet, Chinese blueberries have mostly been directed at internal consumers, however we are beginning to see limited exports in our datasets to regional partners like Singapore. As the country continues to grow, we may find Chinese blueberries with an increased role on the world stage.
*For more information see the Missing or Anomalous Production Data section in About the Data section.
EMEA Production Forecast
EMEA is expected to see a healthy growth rate bringing its production to nearly 650 (000) MT by 2025. Through the better part of the 2000’s the star player has been Southern Europe and North Africa, however, given the large number of hectares not in production that are expected to come on-line in the next four years, Eastern Europe is being projected to overtake these regions by 2025. Another origin to watch will be Africa which is seeing an impressive growth rate with production having matched Western/Central Europe this year, despite several production issues in South Africa, the continent’s leading producer.
Forecast Error
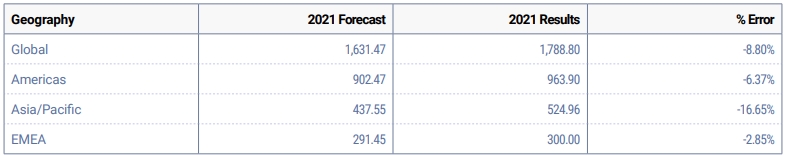
Offering context is crucial to the credibility of any forecast. In the table below we offer the values predicted last year for the 2021 season compared to the actual data collected.
Generally speaking the results of the forecast were quite good, only presenting an 8.8% variance compared to the actual numbers for 2021. The largest error came from Asia, which is mostly due to the lack of reliable data from China. The EMEA error was the lowest at 2.9% thanks to a particularly good forecast of So. Europe/No. Africa, while the Americas was a bit higher than EMEA at 6.37% despite a very low error rate for the US and Canada with higher rates for South America and Mexico/Central America.
Of note is that the error for each producing region is negative, meaning that our methodology consistently under-forecasted actual production. Part of this is due to the production numbers in 2020, which were lower than they could be because of COVID 19 and a myriad of related reasons. The forecasts created with these lower volumes hence produced lower forecasts. As the industry got back up to speed, regions out performed the prediction creating the observed error. Although this isn’t the only reason our forecast was likely to be off, the observation is part of the reasoning behind the emphasis being put on the improvements in the forecast methodology.
For a disaggregation of the forecast error by subregion please visit the Production Forecast Methodology section.
| [[ top10_tables.hectaresByCountry.title ]] | |||||
|---|---|---|---|---|---|
| # | Country | 2019 Hectares | 2020 Hectares | 2021 Hectares | 2022 Hectares |
| [[ top10_tables.productionByCountry.title ]] | |||||
|---|---|---|---|---|---|
| # | Country | 2019 Production | 2020 Production | 2021 Production | 2022 Production |
| [[ top10_tables.freshProductionByCountry.title ]] | |||||
|---|---|---|---|---|---|
| # | Country | 2019 Fresh Production | 2020 Fresh Production | 2021 Fresh Production | 2022 Fresh Production |
| [[ top10_tables.processedProductionByCountry.title ]] | |||||
|---|---|---|---|---|---|
| # | Country | 2019 Processed Production | 2020 Processed Production | 2021 Processed Production | 2022 Processed Production |
| [[ top10_tables.yieldByCountry.title ]] | |||||
|---|---|---|---|---|---|
| # | Country | 2019 Yield | 2020 Yield | 2021 Yield | 2022 Yield |
(Denominated in Hectares and Thousands of Metric Tons)
| [[ tables.region_hectares_table.title ]] | ||||||||
|---|---|---|---|---|---|---|---|---|
| [[ page_title ]] | Planting | 2022 Production | ||||||
| Growth Totals | 2018 | 2019 | 2020 | 2021 | 2022 | Fresh | Process | Total |
| [[ tables.region_production_table.title ]] [[ tables.region_production_table.subtitle ]] | |||||||||
|---|---|---|---|---|---|---|---|---|---|
| [[ page_title ]] | 2020 | 2021 | 2022 | ||||||
| Productions Totals | Fresh | Process | Total | Fresh | Process | Total | Fresh | Process | Total |
| [[ tables.production_metrics.title ]] | |
|---|---|
¹ Growth in volume produced compared to previous season
² Volume increase from new hectares coming into production
³ Volume increase from higher yields
Download Table
Global Highbush Fresh
Report Team Narrative
While Fresh Highbush figures are extensively covered in the different subregions and individual country sections. This space gives us the opportunity to explore general global trends not otherwise covered in the report.
Based on the data collected for the 2021 report the production of fresh blueberries rose by 21% breaking the 1,000 (000) MT mark for the first time in history.
Interestingly we see that every subregion saw an increase in production compared to the previous year. This indicator speaks to the increasing relevance of the blueberry category within fresh produce isles the world over. Further illustrating the continued vitality of the industry, North America, the native home of highbush blueberries, and one of the most established growing regions, continues to see strong growth adding 26 (000) MT over the last season, mostly from increases in yield, which points to replantings with new varieties and updated growing systems in core growing areas.
China and Peru stand out as the countries adding the most volume of fresh blueberries. The Peruvian data is provided from industry sources highly engaged with growing and exporting companies in the sector (the Industry Guild). The Chinese data sources are less concrete and we acknowledge the possibility that the actual hectares and production figures may indeed be lower. All the while there are exciting newer growing regions in Africa and India looking to bring blueberries to new consumers in the years to come.
Blueberries are one of the most exciting and fastest growing produce categories. Thousands of people in this industry steadily work year after year to paint the map of the blueberry world. Many thanks to all the contributors to the data presented in this report, your continued support helps serve a more informed industry seeking to develop a sustainable industry for producers and ever better experience and access to consumers.
| [[ tables.region_production_table.title ]] [[ tables.region_production_table.subtitle ]] | |||||||||
|---|---|---|---|---|---|---|---|---|---|
| [[ page_title ]] | 2020 | 2021 | 2022 | ||||||
| Productions Totals | Fresh | Process | Total | Fresh | Process | Total | Fresh | Process | Total |
Global Wild Production
Report Team Narrative
Wild blueberries have seen a rebound in pricing worldwide since the pandemic began, prompting the reactivation of blueberry barrens in Maine that had been left temporarily fallow following the impacts of oversupply problems in 2016. However, other contributing factors to the steady production decline in the state in the years preceding the pandemic have not gone away – pest and disease pressure, volatile climatic conditions, aging wild blueberry farmers with succession challenges, and the opportunity costs of holding coastal land where these berries are picked that in some cases is being converted to wind and solar farms.
Maine and eastern Canada account for the largest share of global wild blueberry production with the native Vaccinium angustifolium as the main species representing 95% of North America’s crop while the remaining 5% is Vaccinium myrtilloides, also known as the velvet leaf blueberry. Because of the difficulty transporting wild blueberries fresh in marketable condition, 99% of the fruit is frozen with the berries put in the freezer within 24 hours of harvest and stored for up to three years.
A variable climate with a combination of frosts, freezes, drought and higher temperatures has negatively impacted the productivity of wild blueberry fields, which in the lead-up to the 2016 peak season were in a state of expansion in Canada and overall decline in Maine. In 1995 both Maine and Canada had equivalent levels of wild blueberry production, but the Canadian Government released tracts of Crown land to private growers and encouraged growth in the Canadian sector which now produces a much larger volume than the U.S. North America’s 2021 wild crop would have been significantly larger if it weren’t for weather- and drought-related conditions experienced in Quebec.
With an industry spread across different Canadian provinces plus one principal U.S. state, there is a degree of diversification at play with wild blueberries picked – predominantly by machine – in areas with very different conditions, which somewhat, but far from entirely, offsets production volatility. For example, in 2020 Quebec produced by far the largest volume in the continent, but in 2021 it was well behind Maine, and grew less than New Brunswick and Nova Scotia. Prince Edward Island is another production region of note, while Newfoundland has miniscule volumes.
Quebec has a continental climate unlike other Canadian wild blueberry growing provinces with more maritime climate conditions, and the province suffered a crop failure in 2021 prompted by drought and spring frosts, setting it back below levels it had been tracking at for more than a decade. It is worth highlighting Quebec still has opportunity to grow, and the number of acres where wild blueberries have been activated has approximately tripled within two decades. In New Brunswick there is a new strategic plan to release more Crown land, which if implemented would unlock a 69% increase in land for the crop by 2035. Meanwhile, in Nova Scotia some less productive land is due to be taken out of production, but the industry projects it can double output by increasing production inputs. A major limiting factor in Canada will be the availability of pollinators as the native overwintering hives are not strong and the hives produced from Ontario are variable. Maine, in contrast, can source strong, active hives from the southern US and so does not have this limitation.
The fruit is grown in naturally occurring wild stands in the northeast of North America that evolved after glacial retreat 10,000 years ago, and based on observations of the average plant cover, experts estimate an average of 270 different genotypes can be found per hectare. Growers believe it is this diversity that gives the fruit its unique character. Wild blueberries are also smaller than highbush blueberries, and the wild blueberry industry’s proponents claim they also have more antioxidants. The wild blueberry industry continues to invest heavily in lowbush blueberry-specific health research and promotions.
In an environment where demand is currently exceeding supply, the Maine industry has a large domestic focus in addition to Canada-oriented exports, but the state also exports to Japan, South Korea and the EU with overseas shipments aimed at preserving customer bases. Canada exports about half its wild crop to the U.S., in addition to others such as Germany, Japan and China.
Wild production outside of North America is difficult to track and is based on best estimates from industry sources.
In terms of European wild blueberry production, Vaccinium myrtillus or the European bilberry is native to the continent as well as the Caucuses and much of Asia. Scandinavia is a major source of production with bilberry bushes to be found throughout the forests of Norway and Sweden, although only the latter has a sizable commercial industry. However, crops are extremely variable as is access to labor with pickers needing to be flown into the harvest regions in many cases. It is also highly likely, but not corroborated, that the conflict in Ukraine has disrupted wild blueberry harvests in Eastern Europe.
Chinese Wild blueberries
‘Chinese Wild’: Vaccinium Uliginosum L. and Vaccinium Vitis Idaea are native to China, particularly the forested northern provinces of the country. The native Vaccinium Uliginosum is often dark reddish-blue, red or dark blue and often referred to as “蓝莓”(pronounced “Lan Mei”). “Lan Mei” is the most common word used for blueberries in China and now applies to highbush as well. Meanwhile the Vaccinium Vitis Idaea, or Lingonberries, are a deep red and also native to the northern reaches of Europe, especially Scandinavia. These berries are harvested most often by villagers who live near the forested areas where these species grow. The fruit is then sold on to brokers who process the fruit or resell it to processors who sell the finished product. Most of the fruit is now sold domestically, often as a health product in teas, powders, dried fruit, extracts and even cosmetics. Annual production is largely contingent on the amount harvested from the wild and the impact of winter weather on the crop.
‘Chinese Cultivated Lowbush’: Another interesting segment of Chinese domestic blueberry production is the ‘Cultivated Lowbush’ industry. In the far northern provinces of Jilin, Heilongjiang and the continental north of Liaoning, the extreme winters have proven a challenge for traditional highbush production. Early trials conducted in the late 1990s and early 2000’s led by Jilin Agricultural University, showed that the cold hardy Lowbush and ‘Half High’ cultivars were more likely to crop and survive in the harsh conditions. Most of these varieties are considered ornamentals in the rest of the world while a few others represent exemplary selections from Wild patches in North America sourced from the USDA germplasm repository in the 1990’s. Cold hardiness, increased likelihood of protection from snow cover (due to plant height) and apparent tolerance of difficult soil and moisture conditions have led to the large-scale planting of Cultivated Lowbush (in rows) and ‘Half High’ blueberries. Due to mixed information available from China, it is likely that most of the ‘cultivated lowbush’ production from China is represented in the Highbush production and acreage figures for China.
| [[ tables.region_production_table.title ]] [[ tables.region_production_table.subtitle ]] | |||||||||
|---|---|---|---|---|---|---|---|---|---|
| [[ page_title ]] | 2020 | 2021 | 2022 | ||||||
| Productions Totals | Fresh | Process | Total | Fresh | Process | Total | Fresh | Process | Total |
Global Highbush Processed
Report Team Narrative
While processed volume and market growth may have slowed somewhat since 2020 when consumers globally – from the U.S. to South Korea to Australia - hoarded frozen fruit in response to covid, the sector’s situation is still far more robust than before the pandemic when the processed industry had been enduring years of marginal growth and commoditization.
In May 2022 the level of frozen blueberry inventories in Public Storage in the United States - the category’s largest market - were up by around 3%, partly reflecting the year-on-year frozen sales decline in volume (-6.5%, tied to a decrease in North American frozen crop diversion) and value (-4.4%) reported by the U.S. Highbush Blueberry Council (USHBC) for 2021. Another driver may be what one industry veteran described as “the largest ever volume diverted on arrival” from South American fresh blueberries to the processed market. Shipping delays from South America put the quality of imports under pressure in 2021/22, at times leaving processing as the only option apart from wastage for some containers.
The ongoing opacity of global and national frozen inventories and grade transparency plays a perennial role in undermining market stability. With what is effectively a 24-month marketing cycle and a tendency for fruit to suddenly appear from “under a snowbank” (a large portion of the crop remains in private storage which is not reported publicly), inventory and pricing mechanisms for the frozen market can be challenging to track, especially as freezer reports don’t necessarily reflect the grade of the fruit. To illustrate, what can occur are reports of large inventories (e.g. the Public Cold Storage report, which reports volumes in public storage and includes fruit that is sold but not shipped) while packers are in fact struggling to source A-grade frozen blueberries. Despite the ample stock available on paper, there are still shortages of A Grade IQF polybag blueberries at retail in North America.
The relative improvement in the sector’s performance on 2019 levels however cannot be overstated, with the figures in 2021 demonstrating major double-digit growth over the two-year period in value and volume, perhaps also buoyed by speculation over greater losses than what eventuated following the heat dome in the Pacific Northwest. As referenced in the British Columbia section of this report, there were even moments when processed prices were higher than fresh.
Prior to the pandemic, observers had noted a divergence from the previous interlinkages between the fresh and processed blueberry sectors, but since 2020 it appears more of an equilibrium has returned after years of processed-oriented growers exiting the industry. Growers have the option of diverting to processed, both fresh byproduct and higher grade field product, processing plays a useful role in absorbing volumes – a critical channel as fresh blueberry plantings expand globally and the existence of fields with less desired varieties. This is particularly the case for high chill growers. Longer established plantings struggling to serve the fresh market are increasingly diverted to processed. The scaling of processed blueberries is working to the benefit of food manufacturers, juicers, and consumers who either have lower budgets or whose purchasing preferences are driven primarily by the berry’s high antioxidant content.
In regions such as the Pacific Northwest, growing, harvesting, and packing blueberries strictly for processed is also a competitive business model due to the high yields and mechanization of the systems in the region. Most harvesting for processed is already done by machine with sophisticated infrastructure established in mature industries where vertical integration and economies of scale are key; a business model that has risen in tandem with the fresh industry.
The IQF (individually quick frozen) market remains the primary target at the higher end of the processed market. This marks very little change over the last two decades with limited innovation on the product side among the growing, packing, and first handler side of the business. While there are exceptions, the majority of the value creation in processed blueberries is done by CPG companies (small and large) with the packing industry filling the role of an input supplier or at best a vendor of IQF polybags to retail. No doubt there is room for further downstream integration in the industry. Examples of this happening today include growing and packing companies introducing new dried and infused products as well as some new ‘fresh like’ ready-to-eat (RTE) products. Looking to the future it is not unreasonable to assume that there will be a substantial opportunity to create new uses for the market. The question remains as to whether this innovation can also be led by organizations which actually have established supply chains close to the raw product.
Industry efforts to boost consumption of processed blueberries are a key piece of the puzzle for lifting demand and returns for growers. As the product is less difficult to ship than highly perishable fresh blueberries, export market development is a logical pathway to lifting demand, but there is also a need to push more food manufacturing channels within categories such as baking, confectionery, smoothies and yogurts. To be effective, large-scale incorporation is required for this strategy to have a real impact as often a finished food such as a muffin or a protein bar has a very low gram-count of blueberries. What is also problematic is that whilst the fresh market is increasingly seeking out larger-sized berries, some food manufacturers such as bakers tend to seek out smaller-sized frozen blueberries, leaving less margin of error for fresh-oriented growers that shift to larger cultivars.
One sub-division of the processing industry that has struggled the most is juice-grade concentrate, for which inventories are at times high relative to demand. Unlike their peers in crops such as pomegranates, the industry has been unable to achieve the same levels of success for blueberry juice even though the product has similarly flavorful and high-antioxidant attributes. Worthy of inclusion is also the example of the Brazilian acai industry, which has capitalized on the Amazonian fruit’s high antioxidant content with acai bowls and smoothies sold in far-flung trendy cafes and eateries across the developed world.
North America remains the leading processed blueberry growing region and market, having practically doubled since 2010, but China’s processed industry is catching up after jumping three-fold between 2017 and 2020 according to the official figures. It is important to note that a disproportionate amount of China’s processed fruit is of low grade rabbiteyes destined for the juice and puree market. Processed blueberry exports from South America, most notably Chile, Peru and Argentina, have been increasing steadily as well in recent years and play second fiddle in the IQF industry after the leaders in the Pacific Northwest.
The wild blueberry industry is a sector that witnessed greater rises in price during the pandemic. It is understood that North American wild blueberry crops, concentrated in the continent’s northeast, have witnessed strong export performance to Europe where wild blueberry supplies have been hampered to some degree by the Russian invasion of Ukraine.
| [[ tables.region_production_table.title ]] [[ tables.region_production_table.subtitle ]] | |||||||||
|---|---|---|---|---|---|---|---|---|---|
| [[ page_title ]] | 2020 | 2021 | 2022 | ||||||
| Productions Totals | Fresh | Process | Total | Fresh | Process | Total | Fresh | Process | Total |
| [[ tables.region_hectares_table.title ]] | |||||||||||
|---|---|---|---|---|---|---|---|---|---|---|---|
| [[ page_title ]] | Planting (Hectares) | 2022/2023 Production (000) MT | 2022 Production (000) MT | ||||||||
| Growth Totals | 2018/2019 | 2019/2020 | 2020/2021 | 2021/2022 | 2022/2023 | Fresh | Process | Total | |||
| Growth Totals | 2018 | 2019 | 2020 | 2021 | 2022 | Fresh | Process | Total | |||
| [[ tables.region_production_table.title ]] [[ tables.region_production_table.subtitle ]] | |||||||||
|---|---|---|---|---|---|---|---|---|---|
| [[ page_title ]] | 2020/2021 | 2021/2022 | 2022/2023 | ||||||
| [[ page_title ]] | 2020 | 2021 | 2022 | ||||||
| Productions Totals | Fresh | Process | Total | Fresh | Process | Total | Fresh | Process | Total |
| [[ tables.production_metrics.title ]] | |
|---|---|
| [[ tables.tableExportsByPartnerSubregion.title ]] [[ tables.tableExportsByPartnerSubregion.subtitle ]] | |||||
|---|---|---|---|---|---|
| Subregion | 2018/2019 | 2019/2020 | 2020/2021 | 2021/2022 | 2022/2023 |
| Subregion | 2018 | 2019 | 2020 | 2021 | 2022 |
| [[ tables.tableExportsBySubregion.title ]] [[ tables.tableExportsBySubregion.subtitle ]] | |||||
|---|---|---|---|---|---|
| Subregion | 2018/2019 | 2019/2020 | 2020/2021 | 2021/2022 | 2022/2023 |
| Subregion | 2018 | 2019 | 2020 | 2021 | 2022 |
| [[ tables.tableExportsByReporter.title ]] [[ tables.tableExportsByReporter.subtitle ]] | |||||
|---|---|---|---|---|---|
| Reporter | 2018/2019 | 2019/2020 | 2020/2021 | 2021/2022 | 2022/2023 |
| Reporter | 2018 | 2019 | 2020 | 2021 | 2022 |
| [[ tables.tableImportsByOriginSubregion.title ]] [[ tables.tableImportsByOriginSubregion.subtitle ]] | |||||
|---|---|---|---|---|---|
| Origin | 2018/2019 | 2019/2020 | 2020/2021 | 2021/2022 | 2022/2023 |
| Origin | 2018 | 2019 | 2020 | 2021 | 2022 |
| [[ tables.tableImportsByReporter.title ]] [[ tables.tableImportsByReporter.subtitle ]] | |||||
|---|---|---|---|---|---|
| Reporter | 2018/2019 | 2019/2020 | 2020/2021 | 2021/2022 | 2022/2023 |
| Reporter | 2018 | 2019 | 2020 | 2021 | 2022 |